Now we're going to build a dashboard just like mine for energy monitoring. A new Energy tab was introduced to HA last year which is more designed for utility monitoring electrical mains, gas, solar panels. I'm not setup for that as yet although it will be an option in the future. It can do individual devices but it's a bit rudimentary for my likes. I wanted a dashboard that I could look at the current draw in Watts and calculate the devices usage/cost in kWh/£ for daily, weekly, monthly and the previous day. This will give me reasonably accurate figures to plan my energy usage around plus the ability to turn on/off devices. I should note this is give me a rough idea of the costs, it's never going to be 100%.
As an example we'll use the server gear in the attic as it runs off two plugs but this can be adapted for as many devices as you want, just change the names of the sensors! We'll need a few things to start with which can be obtained from the HACS plugin that we installed in the last post, install these!


Tasmota Sensors
Okay so there's a few of the smart plugs sensors we will be concentrating on apart from the outlet on/off function.
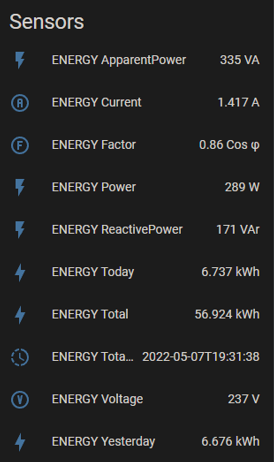
- ENERGY Power in Watts - For current power draw
- ENERGY Today - For usage & cost calculations, daily/weekly/monthly etc are all based off this....it's an important one!
- ENERGY Yesterday - Same as above but only for the previous day
These sensors will all have a unique names based upon the name you have given the device in HA. For example..
- ENERGY Power (w)-
sensor.ultron_energy_power - ENERGY Today (kWh)-
sensor.ultron_energy_today - ENERGY Yesterday (kWh)-
sensor.ultron_energy_yesterday
HA Configuration.yaml
You'll need to use the VS Studio Code plugin or other file editor for this part, Studio Code is the preferred option as it's runs inside HA and features syntax highlighting. I've you haven't already installed it then do so via Settings - Add-Ons - Add-On Store. Once installed and started it will show up on the left hand side bar, open it up and select the configuration.yaml. This file is where we tell HA what to do with the data from the sensors and how to turn those readings into a monetary value for example.
Utility Meters
This function allows HA to track cumulative usage for what ever the input sensor value is, for example, if I wanted to know what the weekly, monthly, yearly reading in kWh usage was for Ultron I would setup a meter to track usage for each of those time periods based upon the ENERGY Today sensor value from the plug named sensor.ultron_energy_today
 # Utility Meters

    utility_meter:
        ultron_energy_daily:
          source: sensor.ultron_energy_today
          cycle: daily
        ultron_energy_weekly:
          source: sensor.ultron_energy_today
          cycle: weekly
        ultron_energy_monthly:
          source: sensor.ultron_energy_today
          cycle: monthly
        ultron_energy_yearly:
          source: sensor.ultron_energy_today
          cycle: yearly
As you can see the first line features the entity ultron_energy_daily The plug sensor already tracks the daily value however I put it in for ease when it came to easy to remember names in the dashboard cards. HA will automatically sum the usage for the cycle period specified. I created a bank of these for each plug I wanted to monitor, all eight of them. I haven't listed them all here as there's too many, see below...
 # Utility Meters

    ultron_energy_daily:
      source: sensor.ultron_energy_today
      cycle: daily
    ultron_energy_weekly:
      source: sensor.ultron_energy_today
      cycle: weekly
    ultron_energy_monthly:
      source: sensor.ultron_energy_today
      cycle: monthly
    ultron_energy_yearly:
      source: sensor.ultron_energy_today
      cycle: yearly

    das_one_energy_daily:
      source: sensor.das_one_energy_today
      cycle: daily
    das_one_energy_weekly:
      source: sensor.das_one_energy_today
      cycle: weekly
    das_one_energy_monthly:
      source: sensor.das_one_energy_today
      cycle: monthly
    das_one_energy_yearly:
      source: sensor.das_one_energy_today
      cycle: yearly
Note there's no utility meter value for yesterday because the plug natively tracks that. It's important to pay attention to indentation in the YAML, also all similar entities must be under one heading, e.g. all Utility Meters MUST be under utility_meter: and like wise all sensors must be under sensor: Go ahead and create the same in your configurations.yaml for all the cycles you want changing the name and sensor value as appropriate....remember to keep it simple! It will take a few hours for HA to start populating the utility meters with data but we can go on to the next stage.
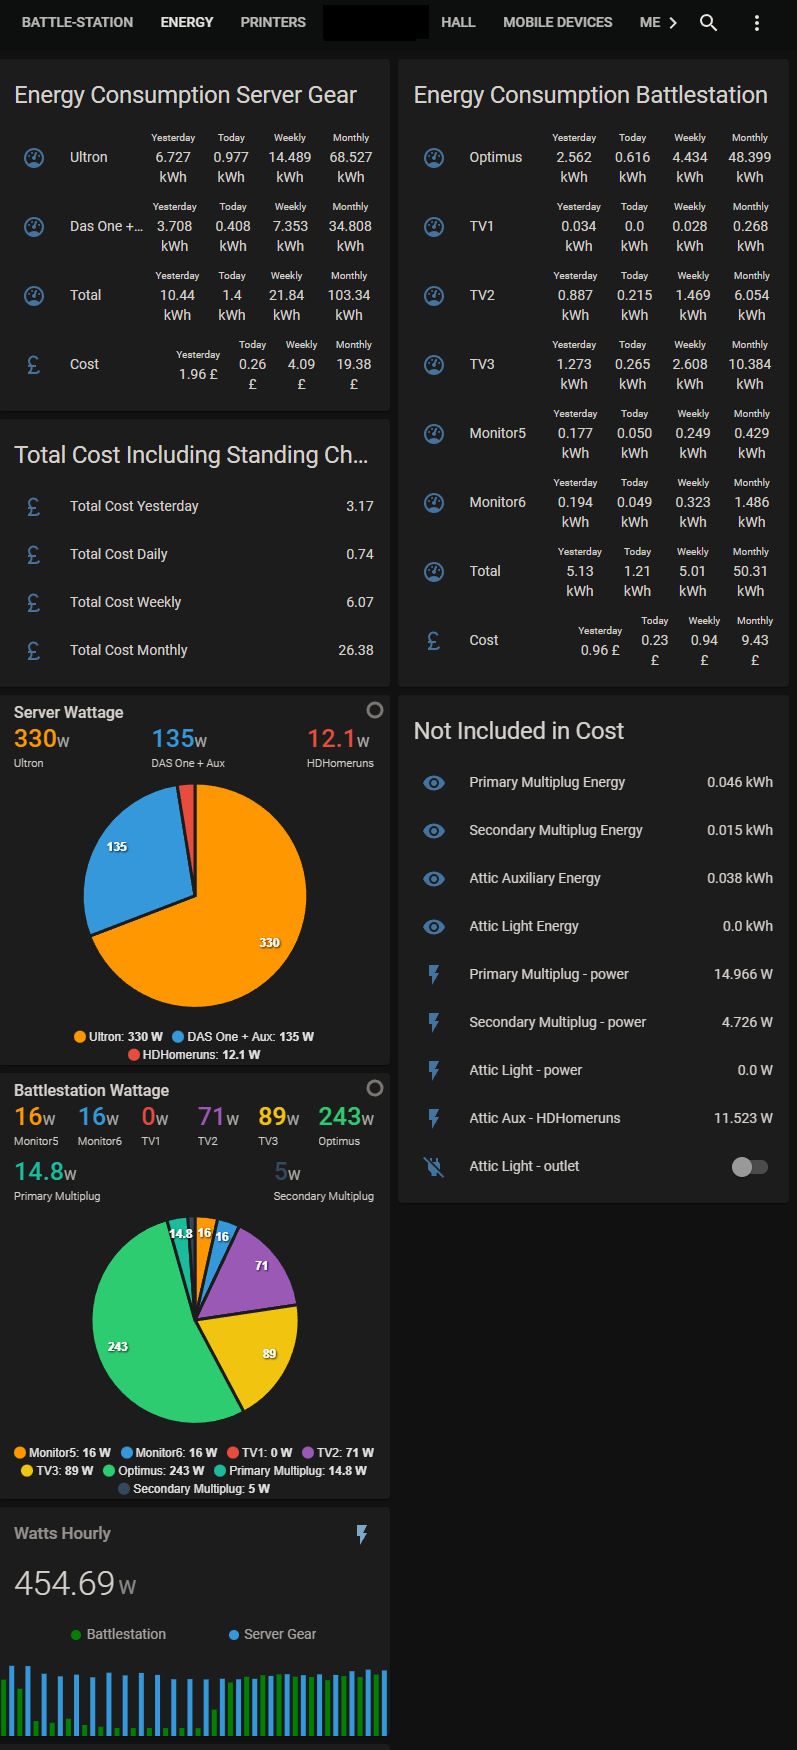
Energy Consumption Card
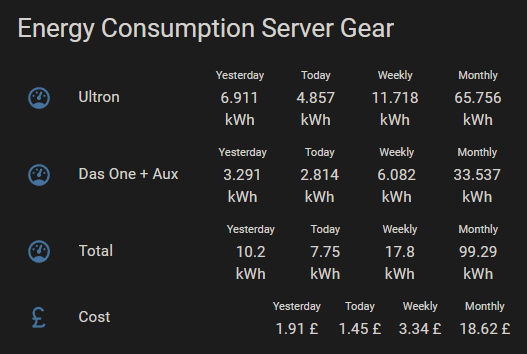
The above dashboard card uses the Multiple entity row which we installed earlier. We can use the utility meters to give the value for Ultron & DAS One for each of the cycles you can see above. As you'll notice we also have a row totalling the energy usage and it's projected cost, where do we get these values from you may ask? Well that's where Template Sensors come in!
Template Sensors
This part concerns entities known as template sensors which derive their values from other data such as our Utility Meters. I'm using them to sum the value of the utility meters for both devices (plugs), all four time periods/cycles & the cost. We need to create another section in the configurations.yaml called sensors: and give our new sensors a name, friendly name (used for the GUI), a unit of measurement, icon to represent it and finally the sum itself. The four sensors will be named...
server_usage_yesterday_powerserver_usage_daily_powerserver_usage_weekly_powerserver_usage_monthly_power
sensor:
- platform: template
sensors:
server_usage_yesterday_power:
friendly_name: "Server Usage Yesterday"
unit_of_measurement: 'kWh'
icon_template: mdi:speedometer
value_template: "{{ (states('sensor.das_one_energy_yesterday') | float +
states('sensor.ultron_energy_yesterday') | float) | round(2) }}"
- platform: template
sensors:
server_usage_daily_power:
friendly_name: "Server Usage Daily"
unit_of_measurement: 'kWh'
icon_template: mdi:speedometer
value_template: "{{ (states('sensor.das_one_energy_today') | float +
states('sensor.ultron_energy_today') | float) | round(2) }}"
- platform: template
sensors:
server_usage_weekly_power:
friendly_name: "Server Usage Weekley"
unit_of_measurement: 'kWh'
icon_template: mdi:speedometer
value_template: "{{ (states('sensor.das_one_energy_weekly') | float +
states('sensor.ultron_energy_weekly') | float) | round(2) }}"
- platform: template
sensors:
server_usage_monthly_power:
friendly_name: "Server Usage Monthly"
unit_of_measurement: 'kWh'
icon_template: mdi:speedometer
value_template: "{{ (states('sensor.das_one_energy_monthly') | float +
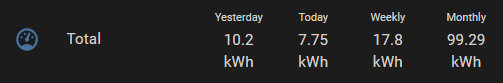
states('sensor.ultron_energy_monthly') | float) | round(2) }}"Okay so this gives four new sensors we can use in our totals row
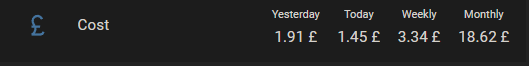
So how do we get the cost for the energy? Simple, more template sensors! We're going to create another sensor called price_per_kwh which has the value value_template: "0.1875" indicating the price in pence (Pound Sterling). This makes things easier in the future if the cost changes as we can change the value here which will filter though the other calculations.
price_per_kWh
## Tariff

      - platform: template
        sensors:
          price_per_kwh:
                friendly_name: "Price per kWh"
                icon_template: mdi:currency-gbp
                unit_of_measurement: '£'
                value_template: "0.1875"
Now we need to create another four sensors just like we did above for the kWh totals that we can use to multiply total kWh values with the price_per_kWh variable which will then give us the cost for each cycle...
cost_server_devices_yesterday_powercost_server_devices_daily_powercost_server_devices_weekly_powercost_server_devices_monthly_power
## Cost Sensors
      - platform: template
        sensors:
          cost_server_devices_yesterday_power:
                friendly_name: "Server Cost Yesterday"
                icon_template: mdi:currency-gbp
                unit_of_measurement: '£'
                value_template: "{{ (states('sensor.server_usage_yesterday_power') | float *
                                                        states('sensor.price_per_kwh') | float) | round(2)  }}"


      - platform: template
        sensors:
          cost_server_devices_daily_power:
                friendly_name: "Server Cost Daily"
                icon_template: mdi:currency-gbp
                unit_of_measurement: '£'
                value_template: "{{ (states('sensor.server_usage_daily_power') | float *
                                                        states('sensor.price_per_kwh') | float) | round(2)  }}"


      - platform: template
        sensors:
          cost_server_devices_weekly_power:
                friendly_name: "Server Cost Weekly"
                icon_template: mdi:currency-gbp
                unit_of_measurement: '£'
                value_template: "{{ (states('sensor.server_usage_weekly_power') | float *
                                                        states('sensor.price_per_kwh') | float) | round(2)  }}"


      - platform: template
        sensors:
          cost_server_devices_monthly_power:
                friendly_name: "Sever Cost Monthly"
                icon_template: mdi:currency-gbp
                unit_of_measurement: '£'
                value_template: "{{ (states('sensor.server_usage_monthly_power') | float *
                                                        states('sensor.price_per_kwh') | float) | round(2)  }}"
Worth noting that HA always places unit_of_measurement as a suffix which isn't ideal when dealing with monetary values, you can delete this part if you wish or remove the symbol.
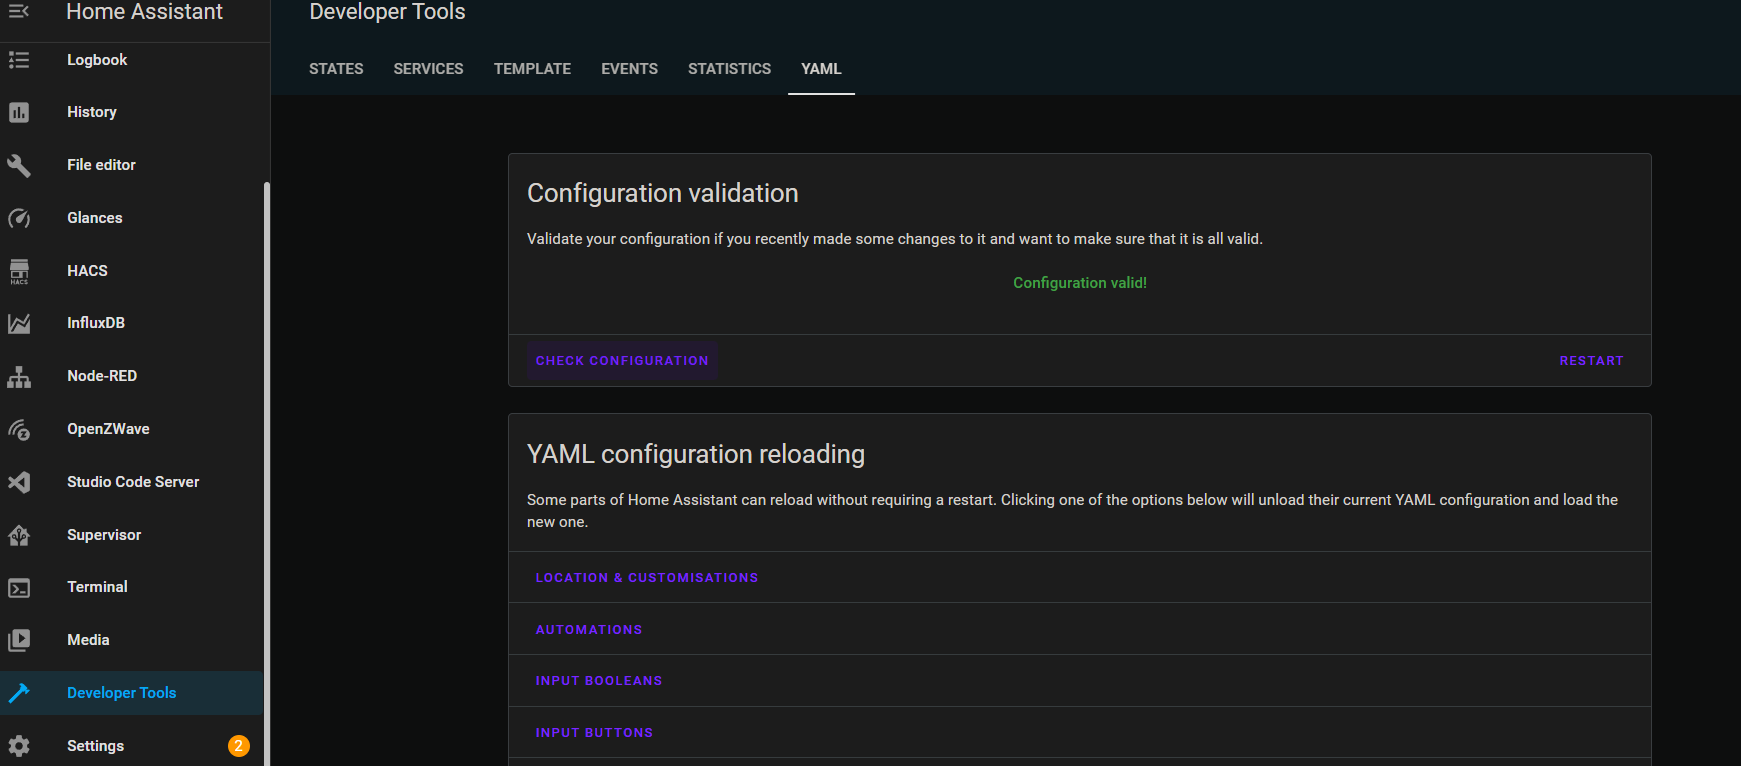
Now we have all the outputs we need to make energy consumption card as seen earlier on. HA will need to be restarted, but before we do the Yaml needs to be checked for errors. Luckily HA comes with with a built in checker which will alert you if something doesn't look right. You need to fix this otherwise it may not boot! Head into Developer Tools - YAML - Check Configuration. Hopefully all is well and you should get a config valid message, if not go back and check everything!
Go ahead and restart HA and wait for it to boot. Head into the Overview tab and edit the dashboard, little icon on the top left. Now we want to set up the energy consumption card and click Add Card - Entities - Show Code Editor, this can't be done in the GUI.
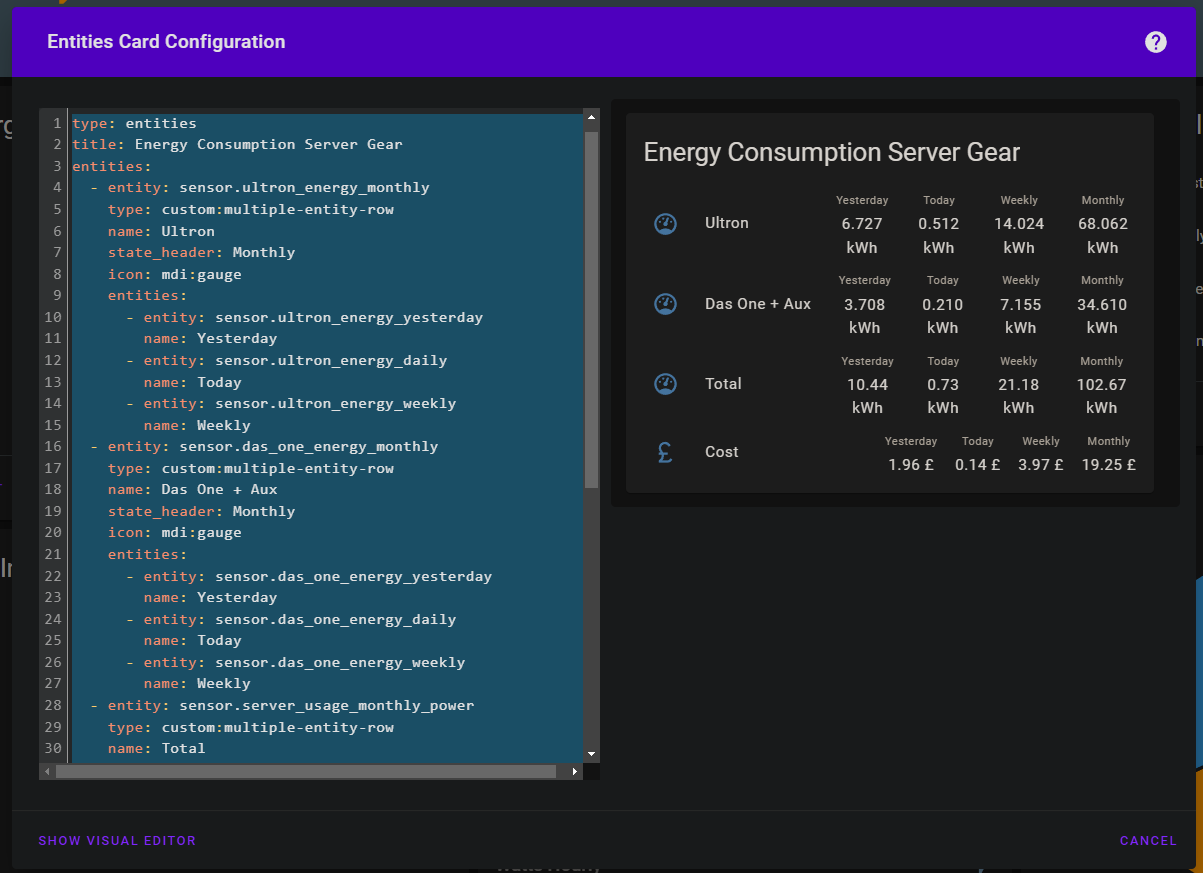
Enter this into the code section swapping the entity names out for yours and hit save! Voila!
type: entities
title: Energy Consumption Server Gear
entities:
- entity: sensor.ultron_energy_monthly
type: custom:multiple-entity-row
name: Ultron
state_header: Monthly
icon: mdi:gauge
entities:
- entity: sensor.ultron_energy_yesterday
name: Yesterday
- entity: sensor.ultron_energy_daily
name: Today
- entity: sensor.ultron_energy_weekly
name: Weekly
- entity: sensor.das_one_energy_monthly
type: custom:multiple-entity-row
name: Das One + Aux
state_header: Monthly
icon: mdi:gauge
entities:
- entity: sensor.das_one_energy_yesterday
name: Yesterday
- entity: sensor.das_one_energy_daily
name: Today
- entity: sensor.das_one_energy_weekly
name: Weekly
- entity: sensor.server_usage_monthly_power
type: custom:multiple-entity-row
name: Total
state_header: Monthly
icon: mdi:gauge
entities:
- entity: sensor.server_usage_yesterday_power
name: Yesterday
- entity: sensor.server_usage_daily_power
name: Today
- entity: sensor.server_usage_weekly_power
name: Weekly
- entity: sensor.cost_server_devices_monthly_power
type: custom:multiple-entity-row
name: Cost
state_header: Monthly
icon: mdi:currency-gbp
entities:
- entity: sensor.cost_server_devices_yesterday_power
name: Yesterday
- entity: sensor.cost_server_devices_daily_power
name: Today
- entity: sensor.cost_server_devices_weekly_power
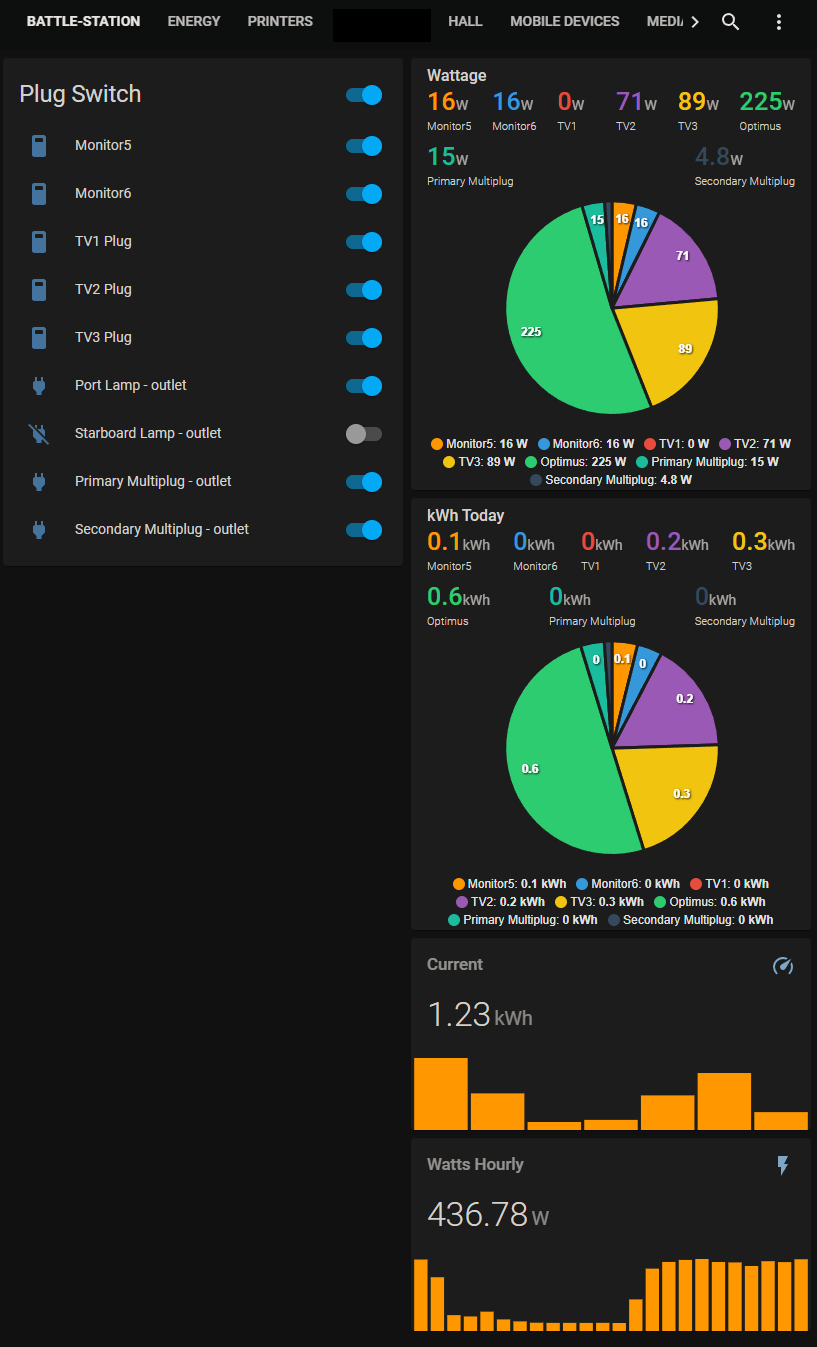
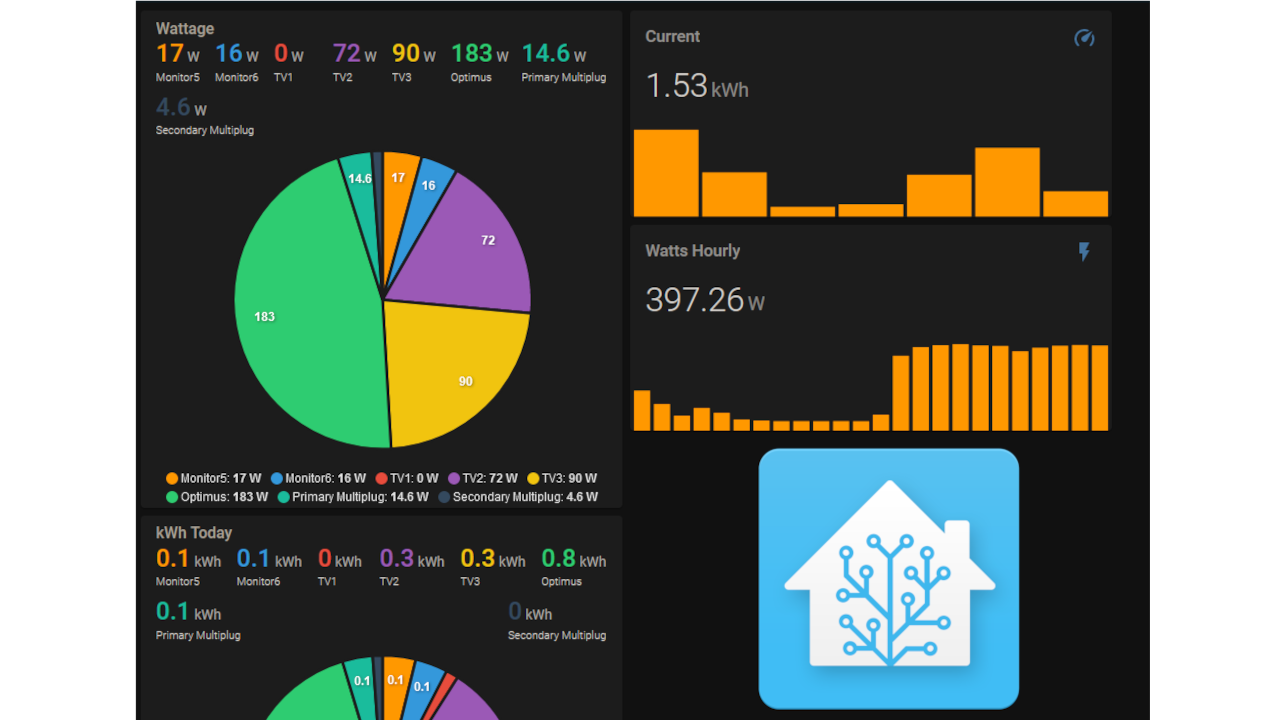
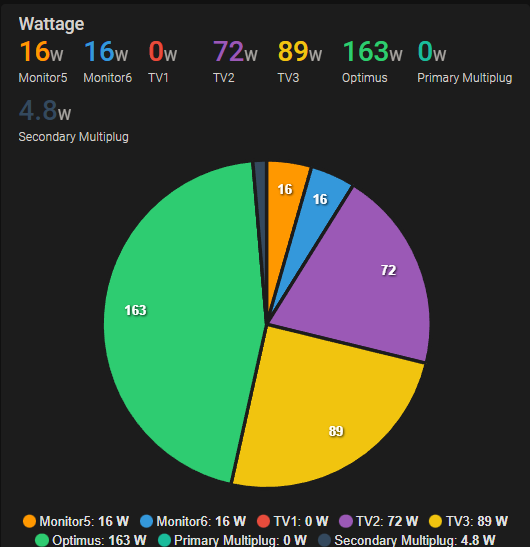
name: WeeklyWattage Pie-Chart
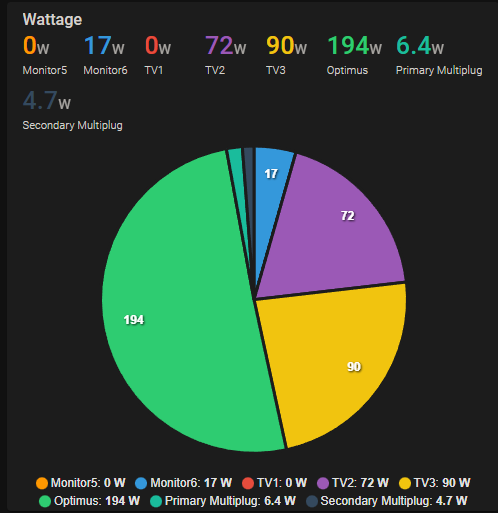
This is a really easy one, no coding required in the Yaml although it does require you to have installed ApexCharts Card from HACS. It's purpose is to provide with an idea of what's drawing power at that current time. It can be added from in the same manner we did for the energy consumption card through editing the dashboard. Select Custom: ApexCharts Card and enter the following in the code editor adjusting sensor names out for your own...
type: custom:apexcharts-card
chart_type: pie
header:
  show: true
  title: kWh Today
  show_states: true
  colorize_states: true
series:
  - entity: sensor.monitor5_energy_today
    name: Monitor5
  - entity: sensor.monitor6_energy_today_2
    name: Monitor6
  - entity: sensor.tv1_plug_energy_today_2
    name: TV1
  - entity: sensor.tv2_plug_energy_today
    name: TV2
  - entity: sensor.tv3_plug_energy_today
    name: TV3
  - entity: sensor.optimus_energy_today
    name: Optimus
  - entity: sensor.primary_multiplug_energy_kwh
    name: Primary Multiplug
  - entity: sensor.secondary_multiplug_energy_kwh
    name: Secondary Multiplug
Watts Hourly Bar Graph
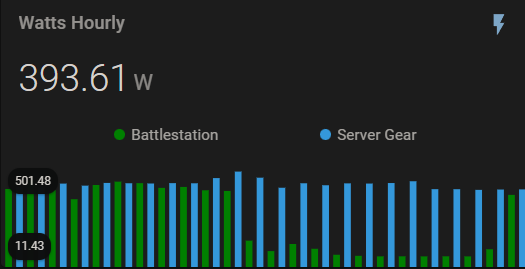
I use this for quick comparison between what my equipment is drawing a both locations, it's not strictly needed as I also have Pie Chart's that cover both values. This will require the creation of another two template sensors which will total all the wattage readings (ENERGY Power) for that group.
server_usage_current_wattagemonitored_devices_current_wattage
      - platform: template
        sensors:
          server_usage_current_wattage:
                friendly_name: "Server Usage Current Wattage"
                unit_of_measurement: 'W'
                icon_template: mdi:speedometer
                value_template: "{{ (states('sensor.das_one_energy_power') | float +
                                                        states('sensor.ultron_energy_power') | float) | round(2) }}"

      - platform: template
        sensors:
          monitored_devices_current_wattage:
                friendly_name: "Monitored Devices Current Wattage"
                unit_of_measurement: 'W'
                icon_template: mdi:speedometer
                value_template: "{{ (states('sensor.monitor5_energy_power') | float +
                                                        states('sensor.monitor6_energy_power_2') | float +
                                                        states('sensor.optimus_energy_power') | float +
                                                        states('sensor.tv1_plug_energy_power') | float +
                                                        states('sensor.tv2_plug_energy_power') | float +
                                                        states('sensor.tv3_plug_energy_power') | float +
                                                        states('sensor.primary_multiplug_power') | float +
                                                        states('sensor.secondary_multiplug_power') | float) | round(2) }}"
Check your Yaml again and reboot. You'll need the Mini graph card for this one. Add the same way as we did for the others and place this code into it...
type: custom:mini-graph-card
icon: mdi:flash
entities:
  - entity: sensor.monitored_devices_current_wattage
    name: Battlestation
    color: green
  - entity: sensor.server_usage_current_wattage
    name: Server Gear
name: Watts Hourly
points_per_hour: 1
hours_to_show: 24
aggregate_func: avg
show:
  graph: bar
  extrema: true
This is my energy dashboard below along with Battle-Station control board. It's a combination of everything we have implemented in this part, there are a few things that aren't covered such as the "Total Cost Including Standing Charge" card and the "Not Included in Cost" card, this will be covered in another part (as their currently in flux) along with how to turn the wH readings the Meross plugs give to kWh.
Here's my full .yaml for reference, personal stuff redacted of course.